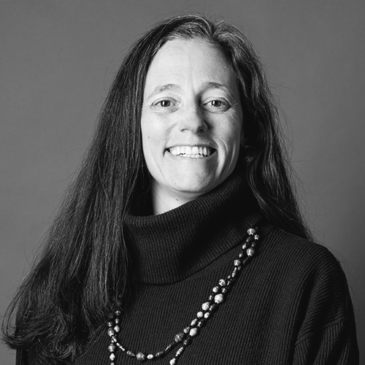
Course list

This course introduces you to policy and data science surrounding income inequality and intergenerational mobility in the United States. You will begin with an in-depth background on sociology, demography, and economics along with an introduction to "big data'' and how it can be used in these fields of study to address complex policy problems. You will also explore essential functions in data science and the language of R before moving on to more complex statistics and data structures that will assist you in articulating big data. You will then investigate income inequality utilizing the Opportunity Atlas data project to examine geographic differences in intergenerational income mobility. Finally, you will further study this mobility across race, ethnicity, and gender, and you will engage in several opportunities to practice your new skill set in R, data, and policy analysis.
  • Jun 24, 2026
  • Oct 14, 2026
  • Feb 3, 2027
  • May 26, 2027

In this course, you will explore the data surrounding racial and ethnic inequalities in the United States, particularly in the areas of educational opportunity outcomes, residential segregation, and housing.

You will examine visualizations of big data and practice analyzing this data in order to understand and convey its implications. You will not only investigate how these issues are defined but also how to measure different forms of inequality, articulate their cause, and utilize the data for informing policy. You will explore the Educational Opportunity Project to develop your data analysis skill set by examining educational inequalities. You will then use R to visualize housing data and residential segregation. Finally, you will continue improving how your data is organized and shared by quantifying the social and economic impact of neighborhood housing and migration potential.

You are required to have completed the following courses or have equivalent experience before taking this course:

  • Income Inequality and Intergenerational Mobility
  • Jul 15, 2026
  • Nov 4, 2026
  • Feb 24, 2027
  • Jun 16, 2027

The COVID-19 pandemic upended our lives in fundamental and enduring ways, impacting not only our health but also the economy, culture, and politics. In this course, you will examine health inequalities and outcomes across different groups in the United States, utilizing the policies and effects of the COVID-19 pandemic as your framework. You will explore the impact of COVID-19 in such areas as employment, healthcare, energy use, patterns of movement, and consumer spending, and you will consider how policies implemented during the pandemic affected these variables for different groups in disparate ways. You will also examine remote data as well as a variety of spatial tools to help visualize the effect of pandemic-related policies.

By leveraging data, you will investigate how policies implemented during the pandemic affected health inequalities and outcomes for different groups in disparate ways across the United States, utilizing the policies and effects of the COVID-19 pandemic as your framework.

You are required to have completed the following courses or have equivalent experience before taking this course:

  • Income Inequality and Intergenerational Mobility
  • Impact of Racial-Ethnic Segregation on Education and Neighborhood Inequality
  • Aug 5, 2026
  • Nov 25, 2026
  • Mar 17, 2027

In this course, you will investigate big data and policy analysis as it is applied to issues of crime, incarceration, and policing practices. Drawing upon an economic perspective, you will examine policymaking in the criminal justice system and how it affects crime rates and mass incarceration trends. Incarceration has disproportionately impacted people of color in the United States, so you will also analyze trends of inequality in the United States criminal justice system and policing practices. Finally, you will explore how algorithms can be used with big data to inform policy and decision making, and you will practice building regression models to make predictions about crime rates.

You are required to have completed the following courses or have equivalent experience before taking this course:

  • Income Inequality and Intergenerational Mobility
  • Impact of Racial-Ethnic Segregation on Education and Neighborhood Inequality
  • Social and Economic Impact of the Early COVID-19 Pandemic
  • May 6, 2026
  • Aug 26, 2026
  • Dec 16, 2026
  • Apr 7, 2027

eCornell Online Workshops are live, interactive 3-hour learning experiences led by Cornell faculty experts. These premium short-format sessions focus on AI topics and are designed for busy professionals who want to gain immediately applicable skills and strategic perspectives. Workshops include faculty presentations, breakout discussions, and guided hands-on practice.

The AI Workshops All-Access Pass provides you with unlimited participation for 6 months from your date of purchase. Whether you choose to attend one workshop per month, or several per week, the All-Access Pass will allow you to customize your AI journey and stay on top of the latest AI trends.

Workshops cover a range of cutting-edge AI topics applicable across industries, hosted by Cornell faculty at the forefront of their fields. Whether you are just getting started with AI, seeking to build your AI skillset, or exploring advanced applications of AI, Workshops will provide you with an action-oriented learning experience for immediate application in your career. Sample Workshops include:

  • Work Smarter with AI Agents: Individual and Team Effectiveness
  • Leading AI Transformation: Bigger Than You Imagine, Harder Than You Expect
  • Using AI at Work: Practical Choices and Better Results
  • Search & Discoverability in the Era of AI
  • Don't Just Prompt AI - Govern it
  • AI-Powered Product Manager
  • Leverage AI and Human Connection to Lead through Uncertainty

How It Works

I like to think outside of the box, and this program from eCornell helped me conceptualize how I want to approach data problems going forward. I was able to actually apply new course concepts to my work, rather than simply repeat steps with different values.
‐ Mark T.
Mark T.

Frequently Asked Questions

Public policy decisions increasingly depend on evidence that can stand up to scrutiny, and that means you need more than dashboards or headlines. Cornell’s Big Data for Policy Certificate helps you build practical, job-relevant data skills while you analyze real, high-stakes issues such as income inequality, racial and educational inequality, the social and economic effects of the COVID-19 pandemic, and crime and incarceration.

In this certificate program, authored by faculty from the Cornell Brooks School of Public Policy, you will learn how to use R in the RStudio environment to clean, analyze, and visualize data, then connect your findings to policy questions and real-world outcomes. Along the way, you will practice core analytics methods such as descriptive statistics, data wrangling, visualization, and regression, with repeated opportunities to strengthen your coding confidence through guided exercises and applied projects.

If you want to build confident R-based data analysis skills, learn to evaluate today’s most urgent equity-related policy questions with real datasets, and communicate findings clearly through credible visualizations and evidence-based narratives, you should choose Cornell’s Big Data for Policy Certificate.

Many online analytics programs are either purely self-paced or focused on generic datasets that do not resemble the messy, contested realities of public-sector work. Cornell’s Big Data for Policy Certificate is different because you learn in an expert-facilitated, cohort-based experience designed to help you apply analytics to consequential policy questions, not just complete isolated technical exercises.

Throughout Cornell’s Big Data for Policy Certificate program, you will work with real, widely used public datasets and research tools that show up in policy and social science practice, then use R to turn those inputs into interpretable results. Across the certificate, the learning design emphasizes applied work, including coding practice, graded projects, and structured peer discussion, so you build both technical capability and the judgment to interpret results responsibly.

You also benefit from eCornell’s human-centered learning model: small cohorts (typically about 35 learners), active discussion, and personalized feedback from an expert facilitator on your submitted work. This approach helps you move from “I watched lessons” to “I can analyze a policy problem, defend my method, and explain what the data does and does not say.”

Enrolling in Cornell’s Big Data for Policy Certificate also provides you with a 6-month All-Access Pass to eCornell's live online AI Workshops, interactive sessions led by world-class Cornell faculty that combine Ivy League insight with practical applications for busy professionals. Each 3-hour Workshop features structured instruction, guided practice, and real tools to build competitive AI capabilities, plus the opportunity to connect with a global cohort of growth-oriented peers. While AI Workshops are not required, they enhance certificate programs through:

  • Integrating AI perspectives across most curricula
  • Responding to emerging AI developments and trends
  • Offering direct engagement with Cornell faculty at the forefront of AI research

The learning experience in Cornell’s Big Data for Policy Certificate is designed for professionals who need to use data to understand, evaluate, and communicate policy-relevant evidence, especially when the topics involve inequality and social outcomes.

The Big Data for Policy Certificate is a strong fit if you are:

  • An aspiring data scientist or analyst looking for a policy-focused way to build R and statistics skills
  • A policy, business, or finance analyst who wants to quantify outcomes across race, ethnicity, gender, education, and geography
  • A social science researcher who wants more hands-on experience working with big datasets and reproducible workflows
  • A government program manager, evaluator, planner, or public-sector professional who needs to translate data into decisions and clear public-facing insights

Because the work is grounded in real datasets and recurring practice, the certificate can work well even if you are new to coding and still building confidence with programming, as long as you are ready to spend time becoming familiar with R and interpreting results.

Project work in Cornell’s Big Data for Policy Certificate is designed to help you practice the full workflow, from getting data into R, to analyzing it, to communicating results clearly with tables, maps, and visualizations. You will complete multi-part, applied assignments such as:

  • Computing and interpreting descriptive statistics in R to quantify inequality and intergenerational mobility across demographic groups, using large-scale mobility data
  • Building maps and visual outputs that show geographic differences in opportunity and outcomes, then explaining what those patterns imply for policy
  • Wrangling and summarizing education and housing datasets using dplyr verbs (filter, select, mutate, summarize, group_by, arrange) to answer targeted inequality questions
  • Creating data visualizations with ggplot2 (histograms, bar charts, line graphs, scatterplots, and faceted views) to communicate trends and comparisons
  • Joining datasets (inner and left joins) to enrich analyses, then producing reproducible outputs using structured workflows
  • Downloading and analyzing remote data, including pulling demographic variables via the U.S. Census API and integrating them into your analysis
  • Visualizing COVID-era trends and policy impacts using time-series charts and spatial (map-based) analysis
  • Fitting and diagnosing regression models in R to analyze relationships among variables and generate interpretable predictions in a criminal justice context
  • Evaluating how algorithms are used in policy decision making, including identifying potential bias and considering approaches to reduce it

Throughout Cornell’s Big Data for Policy Certificate program, you will spend meaningful time coding in R and translating results into policy-relevant insight, which is the core skill set the curriculum is built to develop.

Cornell’s Big Data for Policy Certificate equips you to turn complex, real-world datasets into defensible analysis and clear policy-relevant insights using R.

After completing the Big Data for Policy Certificate, you will be prepared to:

  • Examine how data is used to compare income inequality and intergenerational mobility across race, ethnicity, gender, and geography
  • Analyze and visualize data to determine the impact of racial-ethnic segregation on education and neighborhood inequality
  • Use regression techniques to analyze the relationships among variables to measure the social and economic impacts of the COVID-19 pandemic and the effectiveness of government policies during this time period
  • Examine trends in crime and incarceration that inform criminal justice policy and analyze this data with statistical models that reduce bias

Students who completed the Big Data for Policy Certificate often describe long-term value that shows up in day-to-day work: more confidence using foundational R skills, a clearer and more efficient way to apply statistics to real public challenges, and stronger job-ready analytics capability for evidence-based decision making. Learners also highlight that the program feels intentionally organized and manageable alongside a full-time schedule, and that responsive facilitation helps them keep momentum when questions come up, which makes it easier to actually use the skills after the program ends.

What truly sets eCornell apart is how our programs unlock genuine career transformation. Learners earn promotions to senior positions, enjoy meaningful salary growth, build valuable professional networks, and navigate successful career transitions.

Cornell’s Big Data for Policy Certificate, which consists of 4 short courses, is designed to be completed in 4 months. Each course runs for 3 weeks, with a typical weekly time commitment of 6 to 8 hours.

In practice, the schedule is flexible because most learning activities are asynchronous, so you can watch videos, complete readings, write code, and submit assignments on your own timetable within the weekly deadlines. You also get the benefits of a facilitated course, including guided discussion and feedback on your work, which helps you stay accountable while still fitting the learning into a busy week.

Because the certificate involves hands-on coding and data analysis, setting aside consistent time blocks each week tends to be the most effective approach.

Students in Cornell’s Big Data for Policy Certificate often describe it as a practical, well-organized way to build data skills they can use to analyze real public challenges, even if they are new to programming. They appreciate that the learning experience is intentionally designed to be clear, efficient, and immediately applicable to policy work.

Key themes students highlight include:

  • Applying data and statistics to real policy and societal issues
  • Working through realistic cases using industry-relevant tools
  • Building confidence with foundational R skills through guided practice
  • Gaining job-ready analytics skills for evidence-based decision making
  • Clear, well-structured modules that are easy to follow
  • Concise lessons that still deliver meaningful impact
  • Flexible, self-paced pacing that fits demanding full-time schedules
  • Supportive, responsive instruction and facilitation when questions come up
  • Step-by-step exercises and resources that make learning approachable
  • Strong value for organizations seeking cost-effective upskilling

Overall, students say Cornell’s Big Data for Policy Certificate makes it easier to learn modern analytics in a way that feels relevant to policy contexts, manageable alongside work, and supported by attentive teaching staff.

You will build real competency in using R for policy analysis in Cornell’s Big Data for Policy Certificate, starting with fundamentals and progressing into widely used data science workflows for wrangling, visualization, modeling, and spatial analysis.

Across the Big Data for Policy Certificate, you will work in RStudio and practice with tools and approaches such as:

  • Core R programming concepts for working with common data structures like vectors, matrices, and data frames
  • Data wrangling workflows using tidyverse-style functions, including dplyr verbs and piping (%>%)
  • Data visualization with ggplot2, including trend lines, distributions, and comparative plots
  • Working with remote data sources, including files hosted online and API-based data pulls (such as Census data)
  • Spatial data concepts and mapping so you can interpret geographic patterns in outcomes
  • Regression modeling for interpretable analysis and prediction, with attention to diagnostics and potential bias

The emphasis stays practical: You write code, interpret outputs, and learn how to communicate what the analysis means in a policy context.

The analytical skills you build are grounded in policy challenges where data is central and the stakes are high. In Cornell’s Big Data for Policy Certificate, you will examine how inequality is measured and how outcomes vary across geography and demographic groups, then use that lens to analyze several major policy domains.

You can expect to work with topics that include:

  • Income inequality and intergenerational mobility, including how mobility differs across places and across race, ethnicity, and gender
  • Educational opportunity and school quality, including how to interpret large-scale achievement and learning-rate patterns
  • Residential segregation, housing costs, and eviction dynamics as drivers of neighborhood inequality
  • Health inequality and the social and economic impacts of the early COVID-19 pandemic, including policy responses and recovery patterns
  • Crime trends, mass incarceration, and policing practices, including how policy choices and data-driven tools influence outcomes

Because these topics are paired with real datasets and repeated coding practice, you finish Cornell’s Big Data for Policy Certificate program with a portfolio of methods you can reuse for many other policy questions.

Responsible policy analysis requires more than technical skill. Cornell’s Big Data for Policy Certificate teaches you to question what data represents, how it is measured, and how decisions can be distorted by bias in data, methods, or implementation.

You will practice:

  • Comparing data sources and understanding what each captures and misses when measuring real-world outcomes
  • Interpreting disparities across race, ethnicity, gender, and neighborhood context using large-scale datasets
  • Identifying how model choices can introduce problems such as omitted-variable bias in regression
  • Critically evaluating how algorithms are used in policy decisions, including fairness trade-offs and approaches intended to reduce bias

The result is a more credible analytical skill set: You learn how to produce results, and you learn how to explain limitations and risks in a way that supports better decisions.

Request Information Now by completing the form below.

Act today—courses are filling fast.